Sales Summary Reporting
When you first access the Sales Summary Report page, you will encounter several key elements:
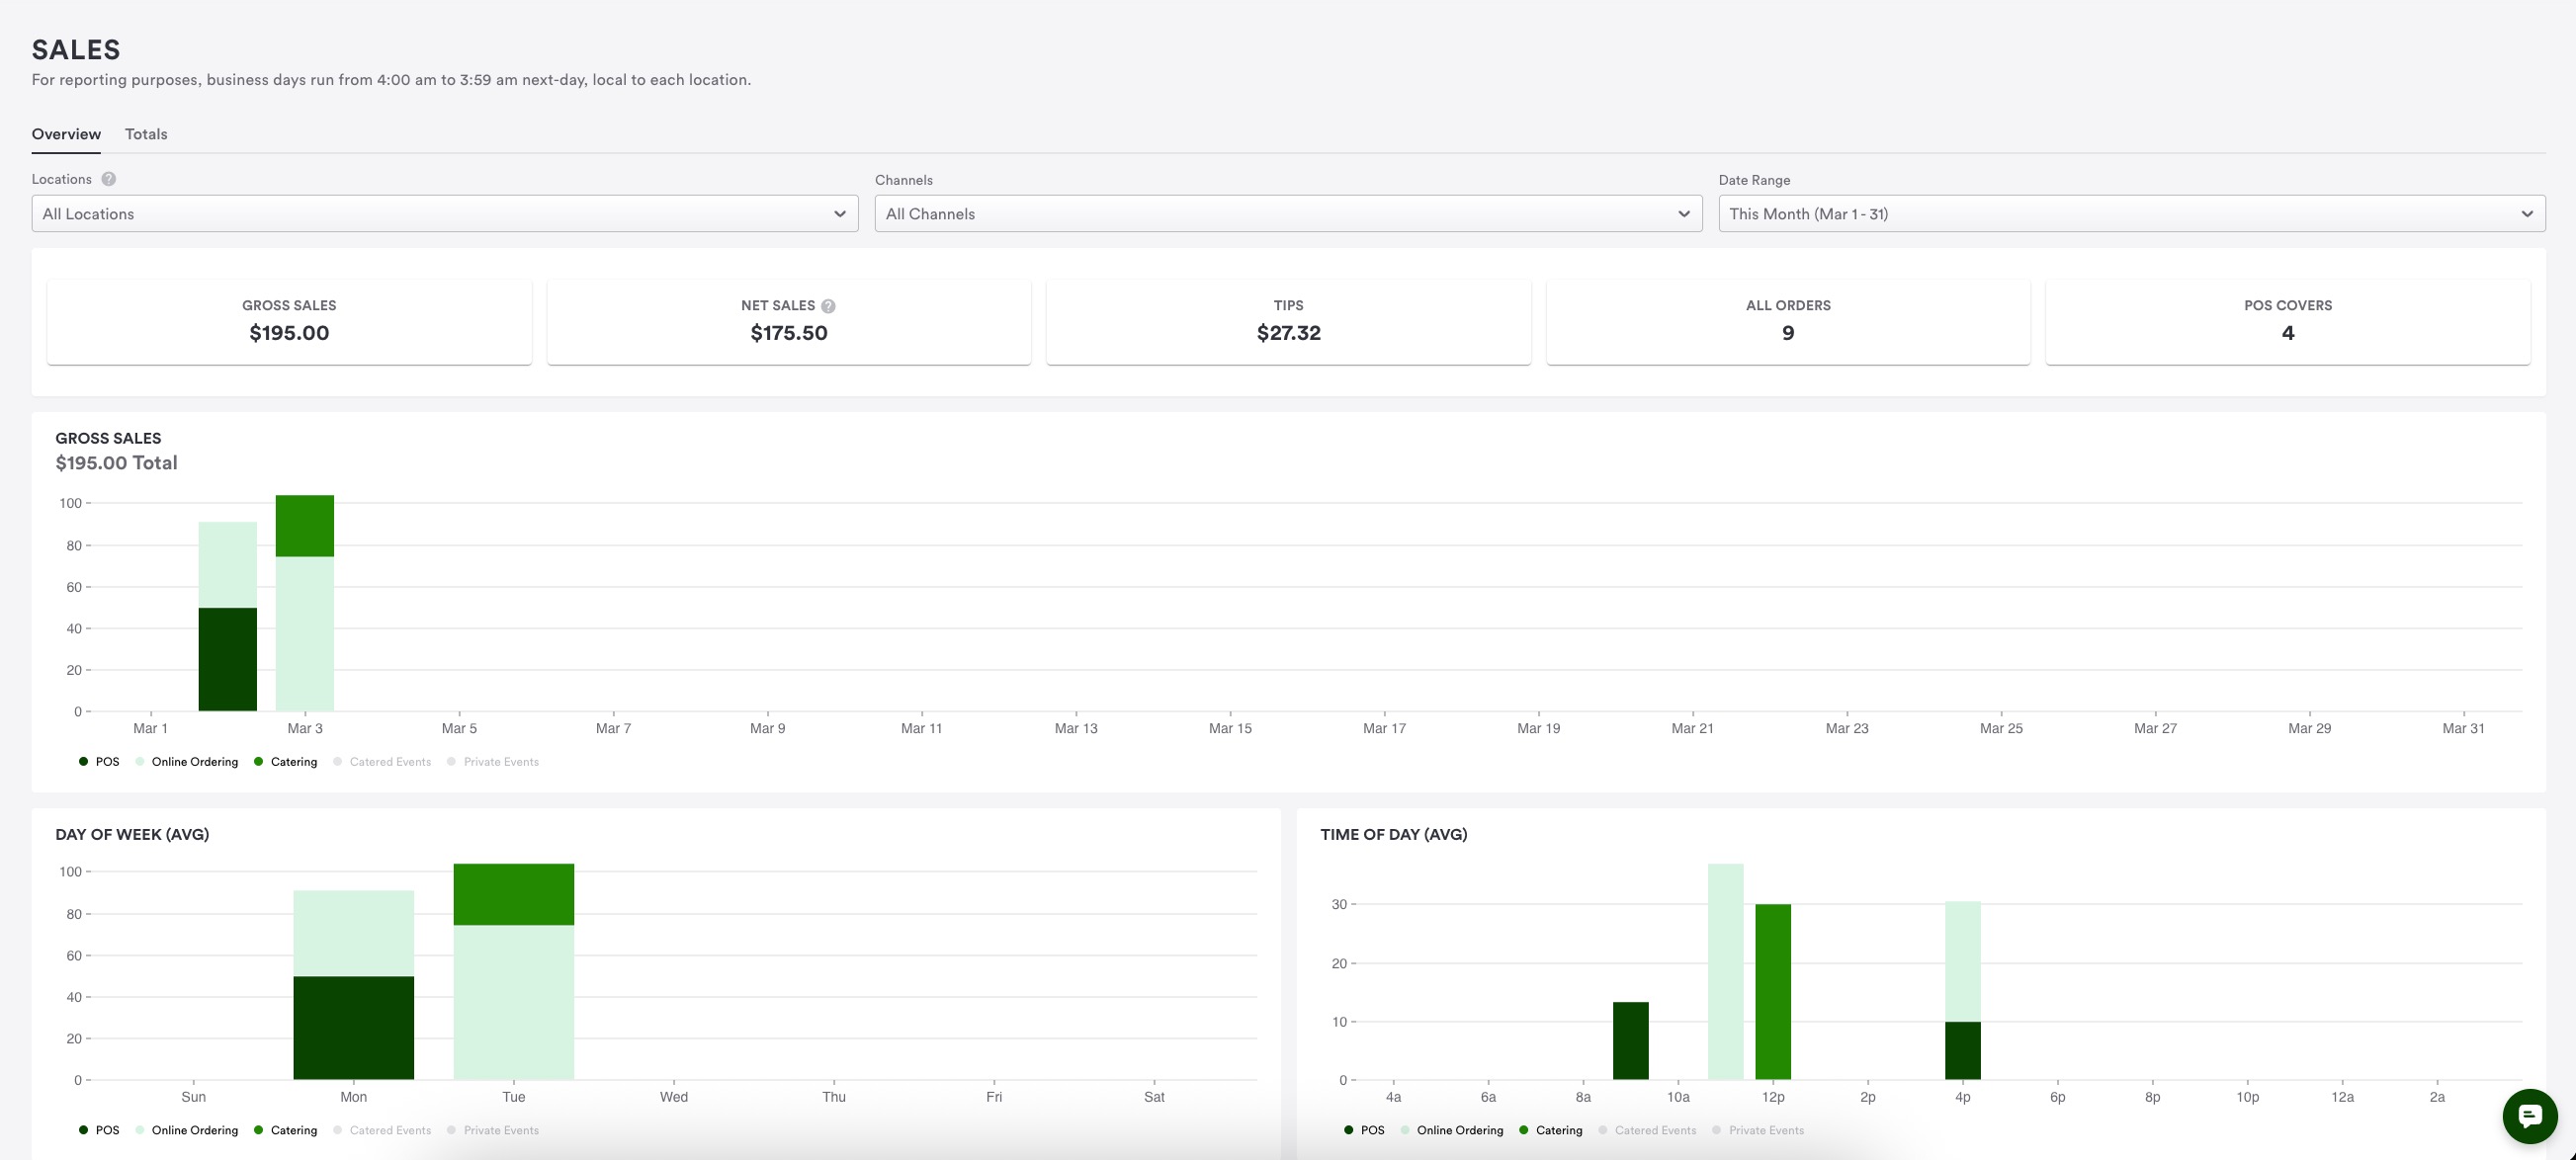
Sales Summary Report Overview
Marquee Cards:
These four boxes provide quick snapshots of data
They are designed to help restaurant operators make informed decisions and understand their sales and revenue activity
Visualization Charts:
These charts offer an overview of sales data
They include new and engaging data points for better insights, such as daily and hourly gross sales averages
Totals Tab:
This tab breaks down revenue into specific data points by sales category and item, and helps you understand the origins of all the numbers presented
Filters Available
To refine the data displayed, you can use the following filters:
Locations Filter:
View data based on all locations, individual locations, or the website location
The website location includes website-level revenue such as merchandise and payment requests not associated with a specific location
Channels Filter:
View revenue by specific channels (i.e. catering or online ordering)
Date Range Filter:
View data by “today”, “yesterday”, “this week”, “last week”, “this month”, “last month”, or a custom date range
Note: the date range is currently limited to the last two years
Detailed Breakdown of Marquee Cards
Gross Sales:
Includes goods and services subtotals, and pocketed fees (e.g. pickup fees, in-house delivery fees, convenience fees, etc.)
Net Sales:
Net Sales is calculated by subtracting discounts and refunds from Gross Sales
Tips:
Includes all tips received, whether on-premise, online ordering, or private events gratuities
Note: Tips are not included in gross and net sales calculations
Orders Count:
The total number of orders received during the selected time range
POS Covers:
The number of POS Covers during the selected time range
Visualization Charts
Gross Sales Chart:
Provides a visual representation of gross sales data
You may hover over the chart to see detailed information for each revenue channel
Adheres to the selected filters
Day of Week Average:
Helps understand sales trends on different days by showing average sales per day of the week
Time of Day Average:
Helps understand sales trends at different times of the day by showing average sales per hour
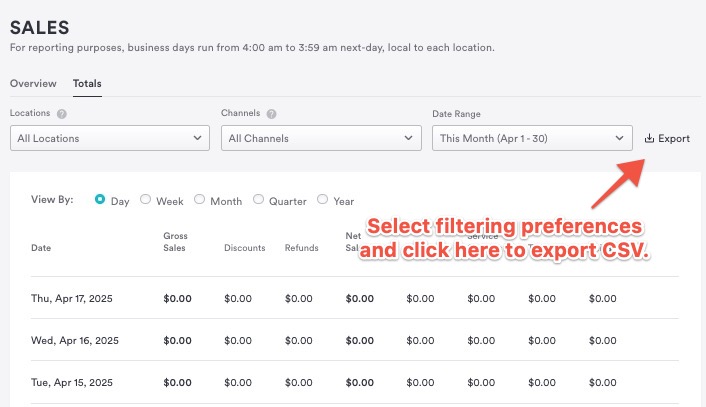
Totals Tab Overview
The Totals Tab provides a detailed breakdown of all the information from the Overview tab, allowing you to view data in a more granular way. The numbers will match those in the overview tab, but you can sort and filter the data to suit your needs.
Filters Available
You can apply the same filters as in the overview tab:
Locations: Sort data by all locations, individual locations, or the new website location
Channel: View revenue from all channels or filter by specific channels like catering or online ordering
Date Range: View data by “today”, “yesterday”, “this week”, “last week”, “this month”, “last month”, or a custom date range. The date range is currently limited to the last two years
Viewing Options
You can view the information on the Totals tab in several ways:
By Day:
View sales data by individual days
By Week:
View sales data on a weekly basis
Helps operators see weekly performance
By Month:
View sales data by month
Useful for end-of-month reporting
By Quarter:
View sales data by quarter
Beneficial for operators who report quarterly
By Year:
View sales data on a yearly basis
Data Points Explained
Gross Sales: Total revenue from goods and services plus pocketed service charges. Note this data point does not include revenue not ultimately retained by the restaurant, i.e. BentoBox fees, taxes, tips, etc.
Net Sales: Gross sales minus discounts and refunds
Discounts: All promo codes, loyalty discounts, and on-premise discounts
Refunds: Total amount processed in refunds
Taxes: Total tax collected by the restaurant
Service Charges: Pocketed service charges kept by the restaurant
Tips: Tips received on all orders
Voids: Relevant only to on-premise users
Export Feature
You can export the data to a CSV file, which will mirror the filtered and sorted view you see on the screen. This allows you to manipulate the data as needed for your restaurant's reporting purposes.