
Product Mix (PIMX) Report
Overview
The Product Mix (PMIX) Report provides detailed insights into item-level POS sales. It helps restaurant operators understand how individual menu items are performing over a selected time period.
Why Use the PMIX Report?
The PMIX Report helps you:
Identify your most and least popular items
Make informed decisions about menu changes and pricing
Optimize inventory and maximize profitability
Key Features
View quantity sold for each item
See each item’s contribution to total sales
Ability to view sales totals by category
Analyze revenue generated per item
Sort by any column for flexible analysis
Filter by custom date ranges
Dashboard view for quick insights
Ability to export this item-level POS sales data
Where to Find the Report
You can access the PMIX Report at the location level, alongside other reports like:
Single Location Sales
Employee Sales
Channel
This filter allows you to adjust the report to only include certain sales channels such as POS, Online Ordering, or Catering. All Channels shows a cumulative report of all totals.
View By
Along with the Channel filter, you can also adjust the report to show just Items or include Sales Categories. You can learn more about Sales Categories here.
Report Timing
Data is collected daily from 4:00 AM to 3:59 AM
Default date range: This Month
Other options include:
Today
Yesterday
Last 7 Days
Last 30 Days
Custom Range
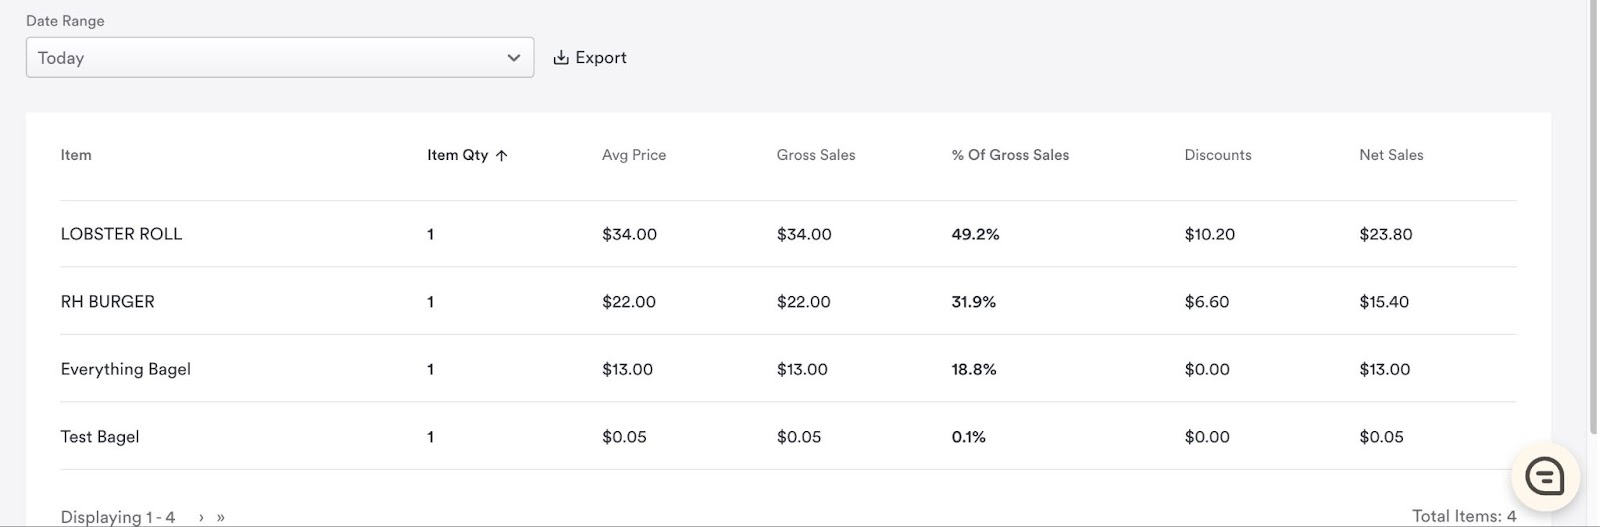
Understanding Report Columns
Column | Description |
Item | Name of the product sold |
Item Quantity | Total number of that item sold in the selected time frame |
Average Price | Average selling price of the item, accounting for any price changes or size variations |
Gross Sales | Total revenue from that item before discounts. Please note, the Gross Sales values listed on the Product Mix report do not include service charges. Service charges are included in Gross Sales on the Sales Report. |
% of Gross Sales | Item’s gross sales as a percentage of total gross sales |
Discounts | Total discounts applied to the item, including proportional distribution from check-level discounts |
Net Sales | Gross Sales minus Discounts |
Example: Average Price Calculation
If an item is sold once at $20 and once at $10:
Total Sales = $30
Quantity = 2
Average Price = $15
Example: Discount Allocation
If a $16.80 discount is applied to a $56 subtotal:
Lobster Roll ($34) = 60.71% of subtotal → receives $10.20 of the discount
RH Burger ($22) = 39.28% of subtotal → receives $6.60 of the discount
Frequently Asked Questions
Q: What if an item has multiple prices during the time frame?
A: The average price reflects the mean of all prices during that period.
Q: How are discounts calculated when multiple items are involved?
A: Discounts are applied proportionally based on each item’s cost.
Q: Is this report available for non-POS customers?
A: Not at this time. Coming soon!