Online Ordering: How to report on your order sales
In this article we’re going to make it easy to find trends with your order sales. You’ll be able to answer:
Who are my highest spenders?
What’s my average revenue per online order?
Step One: Go to Online Ordering.
Log in to the backend and go to “Online Ordering” and then the “Order History” tab.
Step Two: Press “Export.”
You’ll see an “Export” button top right. If you want, you can filter to a location, fulfillment type, and order submission date before exporting your orders.
Step Three: Sum up the column that you are interested in, or save your customer emails or phone numbers for re-marketing.
Go to Google Sheets and create a new sheet. Then choose File > Import > Upload exported csv file.
If You’re Exporting by Order - Follow These Best Practices
How to See Your Largest Orders
Sort your order total column from highest to lowest.
How to See Your Average Revenue Per Order
Go to your order total column and average it. You can do this by entering “=AVERAGE” into a blank cell and then highlighting your full column of order totals for the time period you exported the date for.
If You’re Exporting by Item - Follow These Best Practices
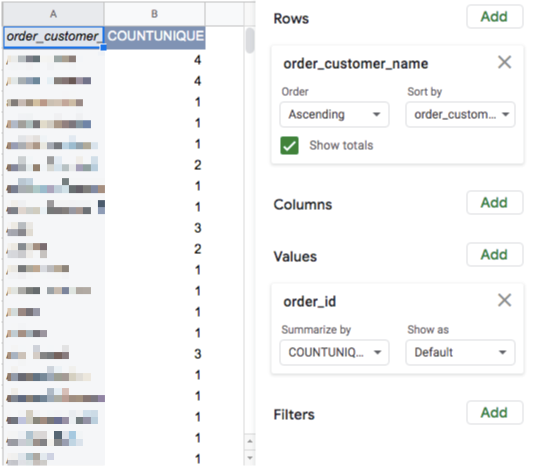
How to Report on Repeat Diners
Go to Data > Pivot Table > New Sheet.
Add “order_customer_email” as a row and choose “Ascending.” Add “order_id” as a value and summarize by “COUNTUNIQUE.”
How to Report on Revenue per Item
Switch back to the original export sheet.
Go to Data > Pivot Table > New Sheet.
Set “product_name” ascending for rows and “unit_price” sum for values.
How to Report on Number of Item Types Sold
Switch back to the original export sheet.
Go to Data > Pivot Table > New Sheet.
Set “product_name” ascending for rows and “quantity” sum for values.
That’s all for now! Don’t use online ordering, catering, merch store, gift cards, or ticketing yet?
Email us at upgrades@getbento.com or contact your customer success manager to learn more.


